14 Runtime Monitor: Production Observability
📋 Overview
In production, events fire thousands of times per second. Debug.Log() creates garbage, floods the console, and provides no structured insight into system health. You need enterprise-grade observability—real-time performance profiling, listener tracking, frequency analysis, and integrity warnings.
The Game Event Monitor is a specialized debugging window that answers critical questions:
- "Which event is causing that frame drop?"
- "Is this event firing too often?"
- "Who is actually listening to this event right now?"
- "Why did my chain sequence break?"
This demo simulates a high-load stress test facility with four specialized test units, each designed to populate specific Monitor tabs with diagnostic data.
- How to open and navigate the Runtime Monitor window
- Reading performance metrics (avg/min/max execution time)
- Analyzing event frequency and detecting spam
- Inspecting listener counts (Inspector vs API bindings)
- Visualizing programmatic Flow Graphs
- Detecting integrity issues (ghost events, broken chains)
- Interpreting warnings and health indicators
🎬 Demo Scene
Assets/TinyGiants/GameEventSystem/Demo/14_RuntimeMonitor/14_RuntimeMonitor.unity
Scene Composition
Visual Elements:
- 🎯 Test Console - Information panel describing 4 test units
- 🧊 Simple Geometry - Plane and Cube (minimal scene)
UI Layer (Canvas):
- 🎮 Four Control Buttons - Bottom of screen
- "Toggle Spammer (Unit A)" → Starts/stops high-frequency spam
- "Trigger Heavy Load (Unit B)" → Fires expensive operation
- "Fire Chain Reaction (Unit C)" → Executes programmatic chain
- "Fire Ghost Event (Unit D)" → Raises event with no listeners
Game Logic Layer:
- 📤 RuntimeMonitorRaiser - Test orchestrator
- 📥 RuntimeMonitorReceiver - Test responder with instrumented listeners
🧪 The 4 Test Units
Each unit is designed to stress-test a specific Monitor subsystem:
Unit A: The Spammer (Frequency Test)
Purpose: Generate high-frequency event spam to test Statistics tab
Configuration:
- Events:
OnSpammer(void),OnSpammerPersistent(void) - Behavior: Fires >60 times/second in
Update()while active - Monitor Goal: Detect high-frequency warnings
Expected Results:
- 📈 Statistics Tab: Shows >60 fires/sec (RED warning)
- ⚠️ Warnings Tab: Flags
[High Frequency]issue
Unit B: The Heavy Lifter (Performance Test)
Purpose: Simulate expensive computation to test Performance tab
Configuration:
- Events:
OnHeavyLoad,OnHeavyLoadCondition(GameObject, DamageInfo) - Behavior: Listener calls
Thread.Sleep(6)to simulate 6ms+ lag - Monitor Goal: Trigger performance warnings
Expected Results:
- ⚡ Performance Tab: Execution time shows 6-12ms (YELLOW/RED)
- 📊 Dashboard: Performance bar turns yellow/red
Code Mechanism:
public void OnHeavyExecution(GameObject sender, DamageInfo info)
{
    // Simulate heavy computation (BAD in production, perfect for testing!)
    Thread.Sleep(6);  // ← Forces 6ms execution time
}
Unit C: The Chain Reactor (Automation Test)
Purpose: Demonstrate programmatic Flow Graph visualization
Configuration:
- Events:
OnChainStart→OnChainProcess→OnChainFinish→OnTriggerComplete - Behavior: Code-built sequential pipeline with delays and conditions
- Monitor Goal: Visualize dynamic automation in Automation tab
Graph Structure:
🚀 [ START ] OnChainStart (DamageInfo)
│   ➔ Payload: { amount: 75.0, type: Physical, ... }
│
├─ ⏱️ [ STEP 1 ] ➔ Delay: 0.5s
│  └─► ⚙️ OnChainProcess (DamageInfo)      ✅ Data Relayed
│
├─ ⚖️ [ STEP 2 ] ➔ Delay: 0.2s | Guard: `amount > 50`
│  └─► 🎯 OnChainFinish (DamageInfo)       ✅ Logic Passed (75 > 50)
│
└─ 🧹 [ STEP 3 ] ➔ Trigger Mode | Block Args
   └─► 🏁 OnTriggerComplete (void)        ✅ Signal Purified
│
📊 Result: Pipeline Completed | 🛡️ Data Safety: Argument Blocked at Exit
Expected Results:
- 🔗 Automation Tab: Shows hierarchical tree with timing/condition badges
- 📝 Recent Events Tab: Sequential firing pattern visible
Unit D: The Ghost (Integrity Test)
Purpose: Detect events fired with no listeners
Configuration:
- Event:
OnGhost(void) - Behavior: Raises event with zero listeners bound
- Monitor Goal: Trigger integrity warning
Expected Results:
- ⚠️ Warnings Tab: Shows
[No Listeners]warning - 📊 Dashboard: Warning count increases
🎮 How to Test (Step-by-Step)
Phase 1: Preparation
Step 1: Open Monitor Window
-
Menu
The utility is located within the Game Event System, you can access through the following method:
From the System Dashboard:
Game Event System Window → Click "Game Event Monitor" -
Window appears
dockable like any Unity Editor window
Step 2: Enter Play Mode
- Click Unity's Play button
- Monitor remains visible during play
Phase 2: Generate Test Data
Step 3: Activate Unit A (Spammer)
- Click "Toggle Spammer (Unit A)" button
- Observe: Button stays active (toggled ON)
- Effect:
OnSpammerfires >60 times/second
Step 4: Activate Unit B (Heavy Load)
- Click "Trigger Heavy Load (Unit B)" button 3-5 times
- Effect: Each click triggers one expensive operation (6ms lag)
Step 5: Activate Unit C (Chain Reaction)
- Click "Fire Chain Reaction (Unit C)" button once
- Effect: Initiates 4-step sequential pipeline
Step 6: Activate Unit D (Ghost Event)
- Click "Fire Ghost Event (Unit D)" button once
- Effect: Raises event with no listeners (integrity violation)
After triggering all units, wait 5-10 seconds to accumulate data before analyzing Monitor tabs.
📊 Monitor Window Analysis
Tab 1: 🏠 Dashboard (System Health Overview)
The landing page—aggregates metrics from all subsystems into a single health report.
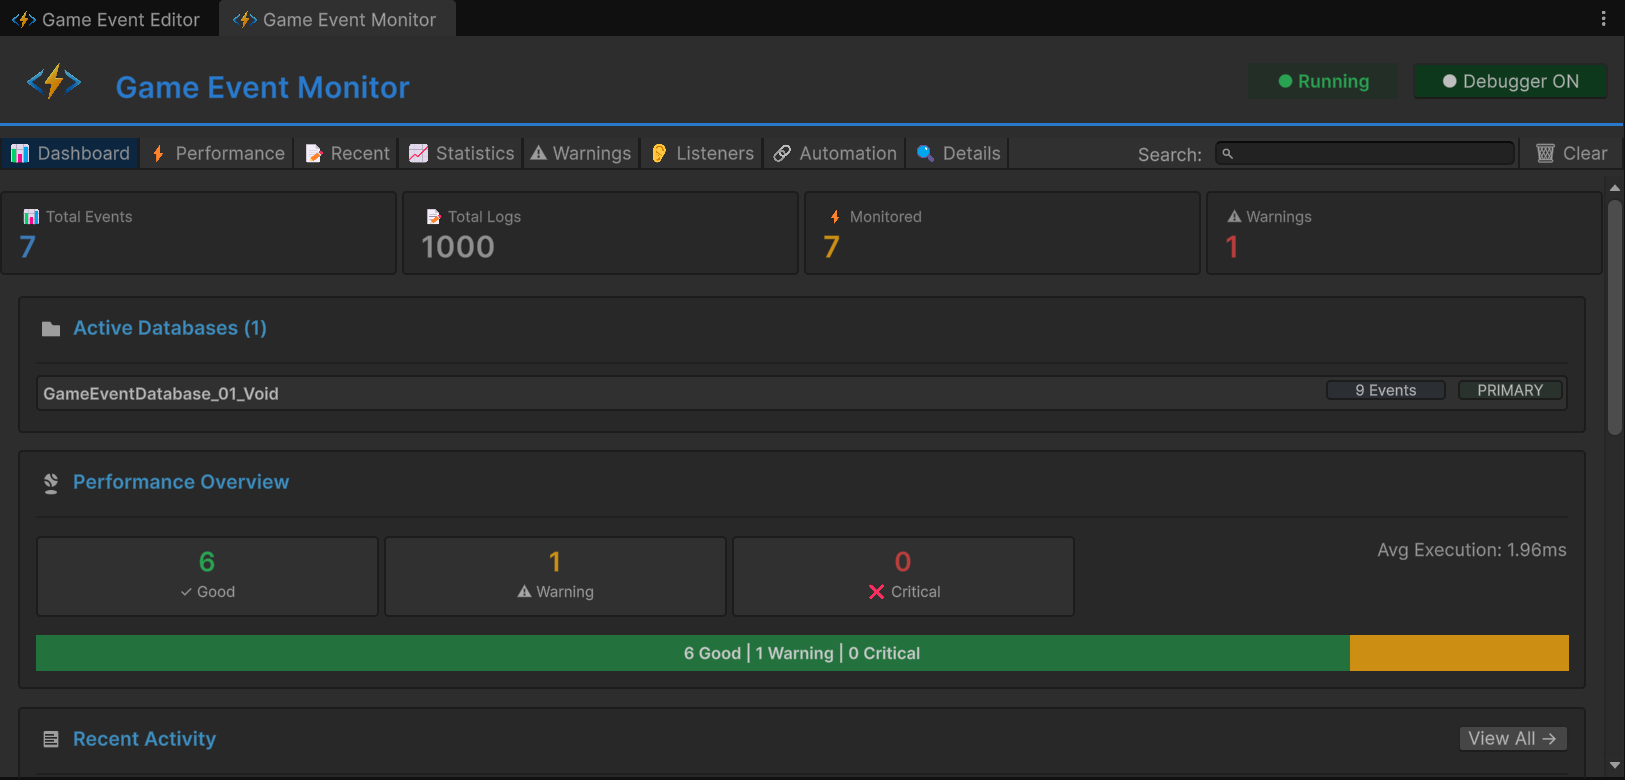
Metric Cards (Top Row):
| Card | Meaning | Expected Value |
|---|---|---|
| Total Events | Loaded event count | 9 |
| Total Logs | Cumulative fires since play start | 500+ (climbing) |
| Monitored | Events with active performance tracking | 4-6 |
| Warnings | Current active issues | 2+ (Spam + Ghost) |
Active Databases Section:
- Lists all loaded database assets
- PRIMARY badge shows main database
- Click database name to filter views
Performance Overview (Traffic Light Bar):
- 🟢 Green: All events <1ms (healthy)
- 🟡 Yellow: Some events 1-5ms (caution)
- 🔴 Red: Events >5ms detected (critical)
- Shows percentage distribution
Recent Activity (Mini-Log):
- Last 15 event firings
- Format:
[Frame] EventName (args) - Click to jump to Details tab
Quick Warnings (Top 3):
- Most critical alerts surfaced
- Severity icons: 🔵 Info, 🟡 Warning, 🔴 Critical
- Click to jump to Warnings tab
Single-glance system health check—like a car's instrument panel. If this shows red/yellow, drill into specific tabs for diagnosis.
Tab 2: ⚡ Performance (Execution Profiling)
Focus: Detect performance bottlenecks by execution time
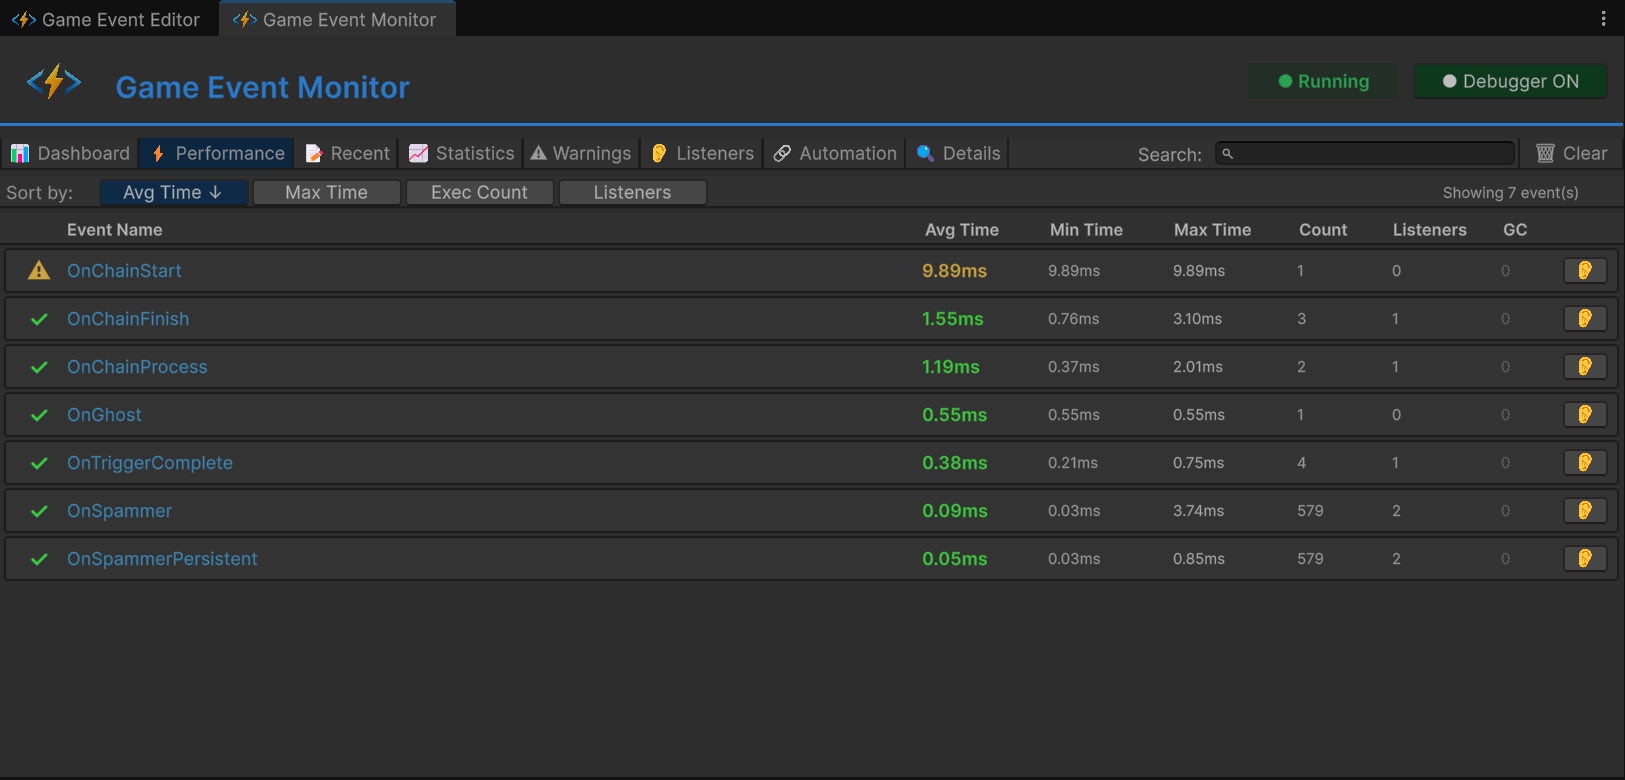
Columns:
| Column | Meaning | Healthy Range |
|---|---|---|
| Event Name | Event identifier | - |
| Avg Time | Average execution ms | <1ms 🟢 |
| Min Time | Fastest execution | - |
| Max Time | Slowest execution | <5ms 🟡, >5ms 🔴 |
| Listeners | Avg listener count per fire | - |
| GC Alloc | Garbage generated per fire | 0 KB ideal |
Color Coding:
- 🟢 Green: 0-1ms (excellent)
- 🟡 Yellow: 1-5ms (monitor)
- 🔴 Red: >5ms (investigate)
Test Results (Unit B):
- Locate
OnHeavyLoadevent in table - Avg Time: Shows ~6.00ms (🟡 Yellow)
- Max Time: May show ~12.00ms if clicked multiple times (🔴 Red)
- Cause:
Thread.Sleep(6)in listener code
Usage:
- Sort by "Avg Time" to find worst offenders
- Click event name to see Details tab
- Compare listener counts—more listeners = higher risk
General rule: Keep avg execution time <1ms. Budget total frame time (16ms @ 60fps) across all systems.
Tab 3: 📝 Recent Events (Real-Time Event Log)
Focus: Chronological stream of all event firings
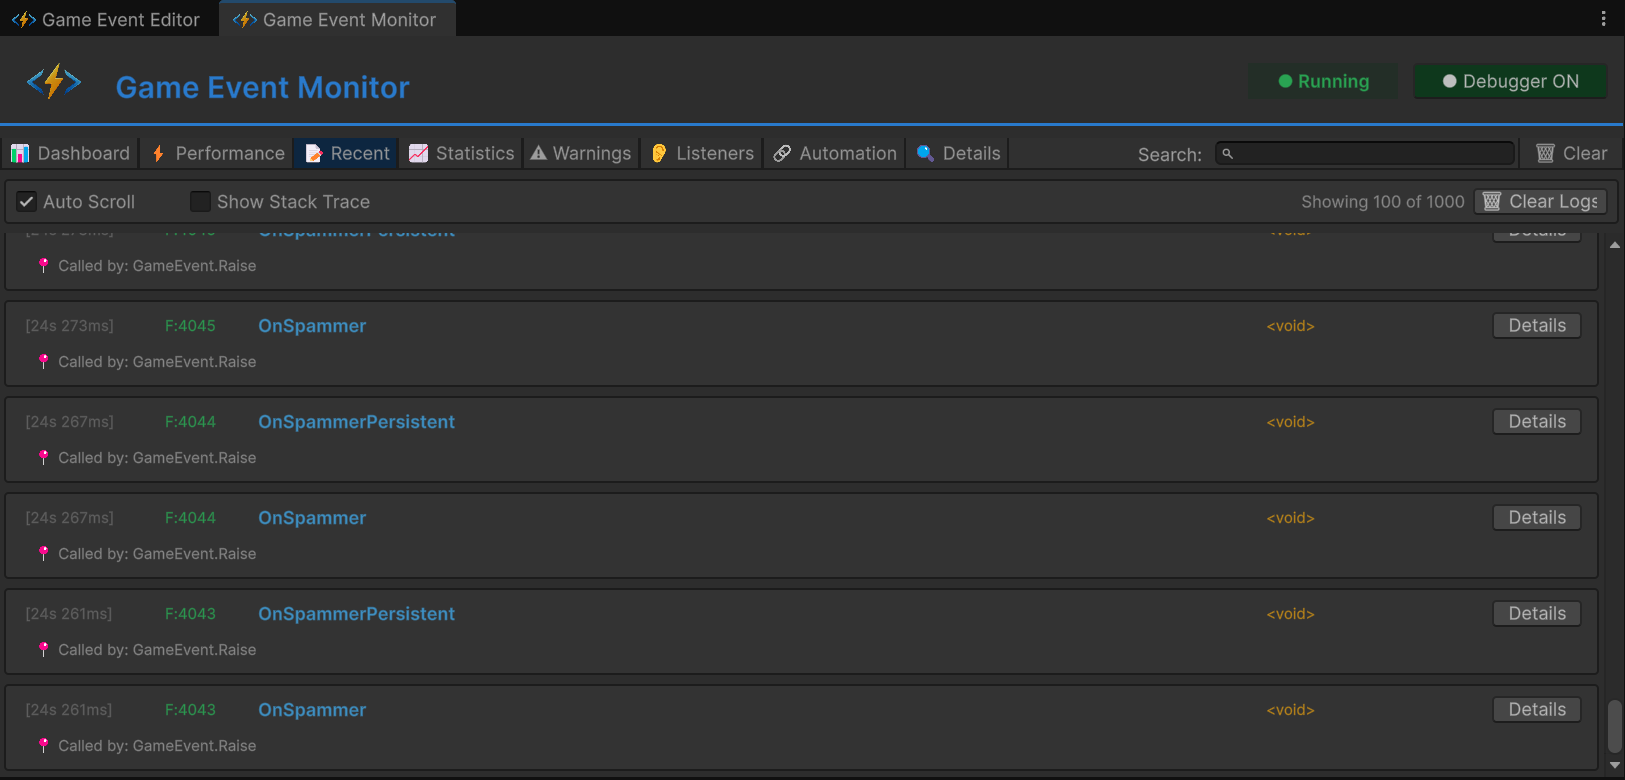
Columns:
| Column | Meaning | Example |
|---|---|---|
| Frame | Unity frame number | F:1450 |
| Time | Timestamp since play start | 12.45s |
| Event | Event name | OnHeavyLoad |
| Arguments | Payload preview | <DamageInfo: 100> |
| Caller | Method that called .Raise() | RuntimeMonitorRaiser.TriggerHeavyLoad |
Features:
- 🔍 Search: Filter by event name
- 📋 Stack Trace: Toggle to see full call stack
- 🔗 Details Link: Click event to see deep dive
Test Results (All Units):
- Unit A: Rapid succession of
OnSpammerentries (60+/sec) - Unit C: Sequential pattern:
OnChainStart→ (delay) →OnChainProcess→OnChainFinish→OnTriggerComplete - Unit D: Single
OnGhostentry
Usage:
- Verify event firing order (sequential vs parallel)
- Debug unexpected event triggers
- Investigate caller methods (who's raising this?)
Unlike Unity Console, this log is specialized for events—no noise from other Debug.Log calls, structured data preview, direct caller info.
Tab 4: 📈 Statistics (Frequency Analysis)
Focus: Long-term usage patterns and frequency tracking
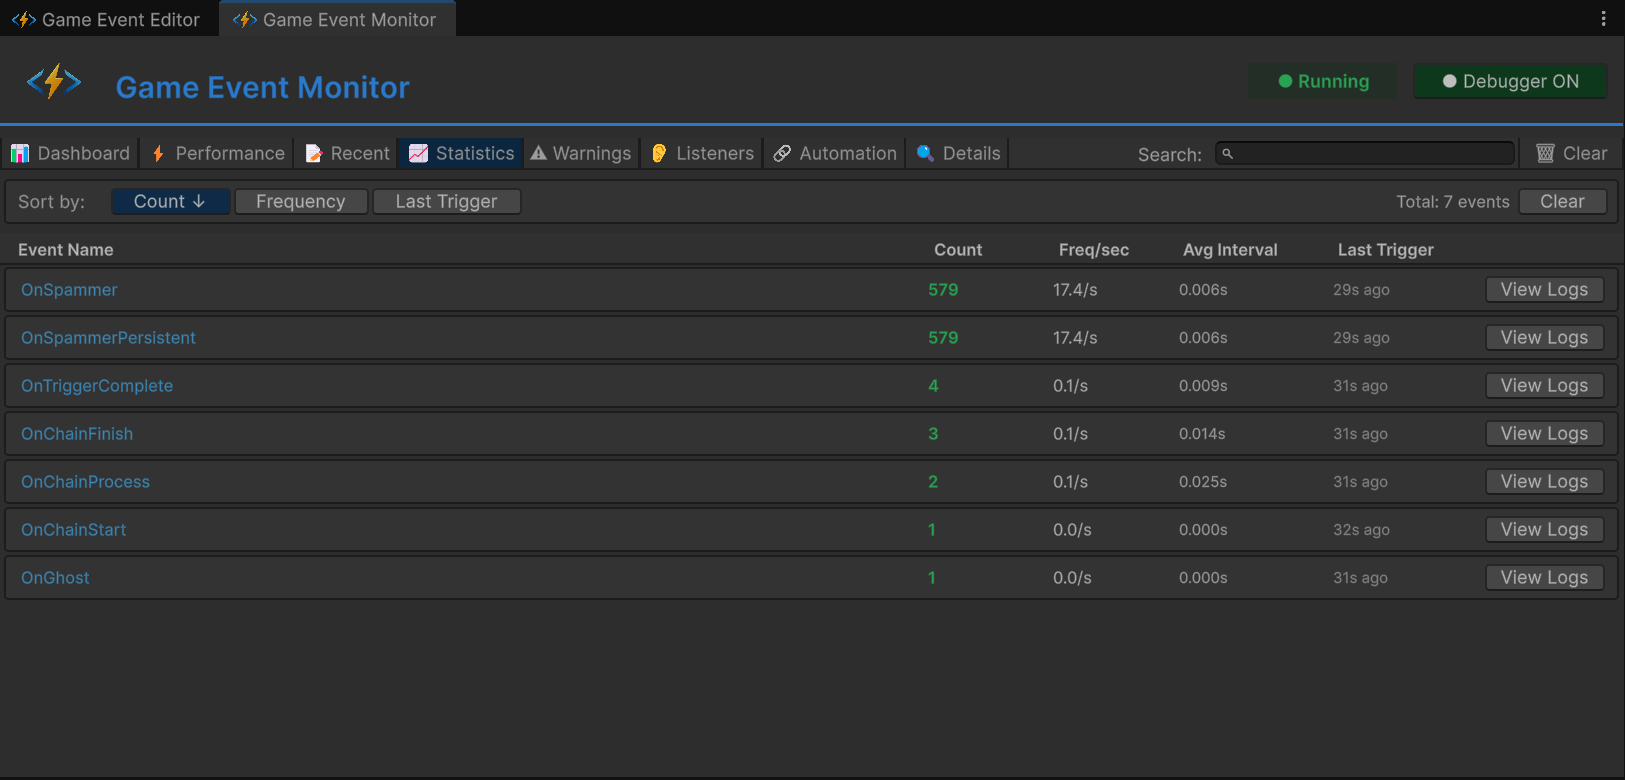
Columns:
| Column | Meaning | Healthy Range |
|---|---|---|
| Event Name | Event identifier | - |
| Trigger Count | Total fires since play start | - |
| Freq/sec | Fires per second | <10 🟢, 10-30 🟡, >30 🔴 |
| Avg Interval | Time between fires (ms) | >100ms ideal |
| Last Trigger | Time since last fire | - |
Test Results (Unit A):
- Locate
OnSpammerevent - Trigger Count: Rapidly climbing (1000+ after 10sec)
- Freq/sec: Shows >60/s (🔴 Red warning)
- Avg Interval: Shows ~16ms (every frame at 60fps)
Warning Triggers:
- 🟡 Yellow: 10-30 fires/sec
- 🔴 Red: >30 fires/sec (potential performance issue)
Usage:
- Identify event spam (too frequent)
- Detect idle events (never firing)
- Analyze firing patterns over time
- >60/sec: Likely firing every frame—consider batching
- Irregular spikes: May indicate logic bug
- Zero frequency: Dead code or misconfigured event
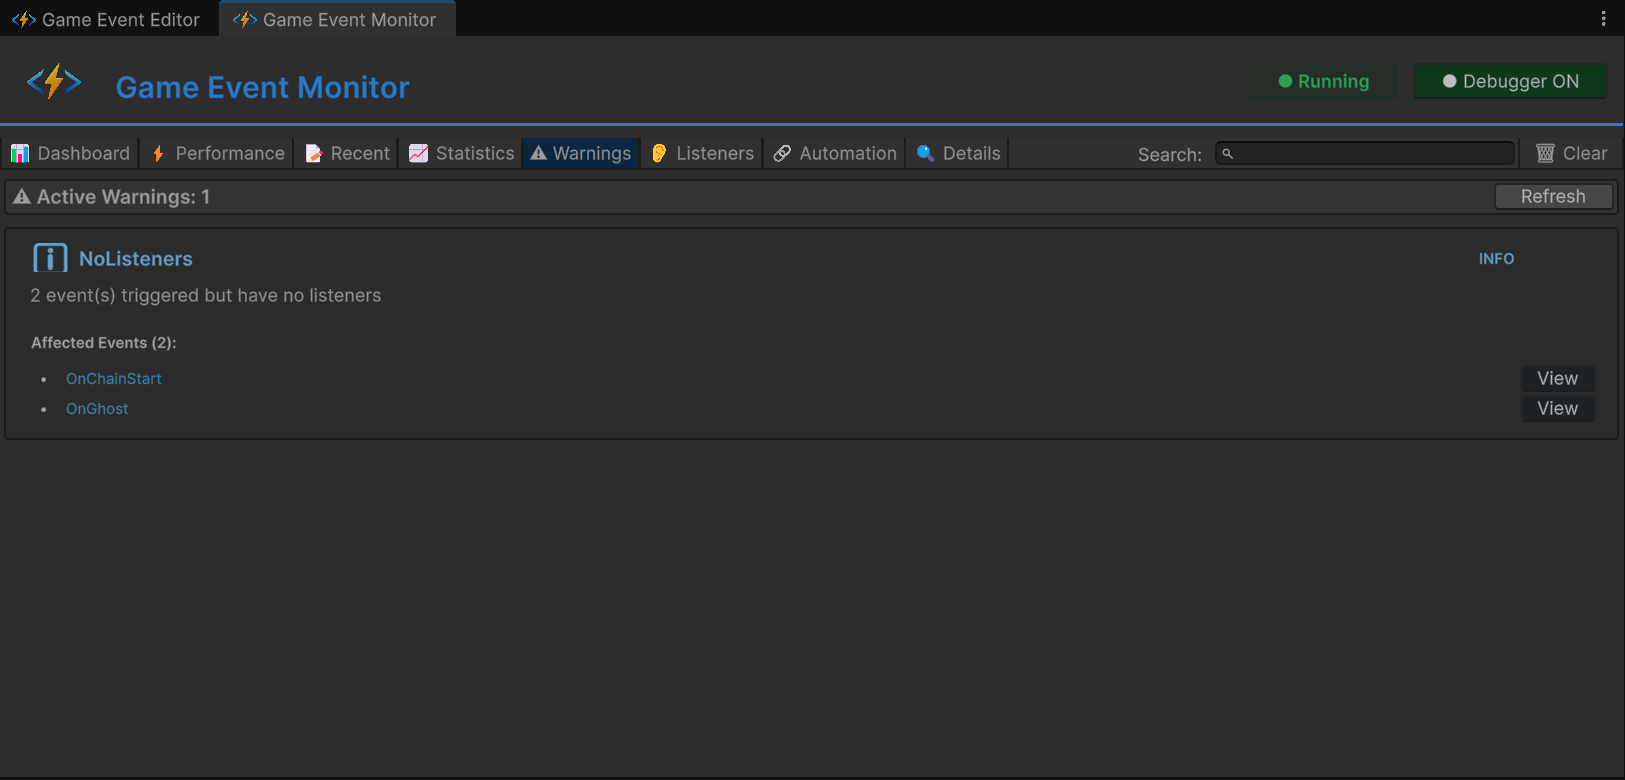
Tab 5: ⚠️ Warnings (Integrity & Health Alerts)
Focus: Filter noise, surface critical issues
Severity Levels:
| Icon | Level | Meaning |
|---|---|---|
| 🔵 | Info | Advisory notice (FYI) |
| 🟡 | Warning | Non-critical issue (monitor) |
| 🔴 | Critical | Severe problem (fix immediately) |
Warning Types:
| Warning | Trigger | Severity |
|---|---|---|
[No Listeners] | Event raised but no listeners bound | 🔵 Info |
[High Frequency] | Fires >30 times/sec | 🟡 Warning |
[Performance] | Execution time >5ms | 🔴 Critical |
[GC Pressure] | Garbage allocation >1KB/fire | 🟡 Warning |
Test Results:
- Unit A:
OnSpammer - [High Frequency] Firing at 62/sec - Unit D:
OnGhost - [No Listeners] Event raised with zero subscribers
Usage:
- Check after major feature additions
- Monitor during stress tests
- Ignore expected warnings (e.g., debug events)
[No Listeners] warnings are usually bugs—either:
- Listener registration failed (check
OnEnable) - Event asset reference is wrong
- Dead code (remove the
.Raise()call)
Tab 6: 👂 Listeners (Subscription Inspector)
Focus: Granular breakdown of WHO is listening
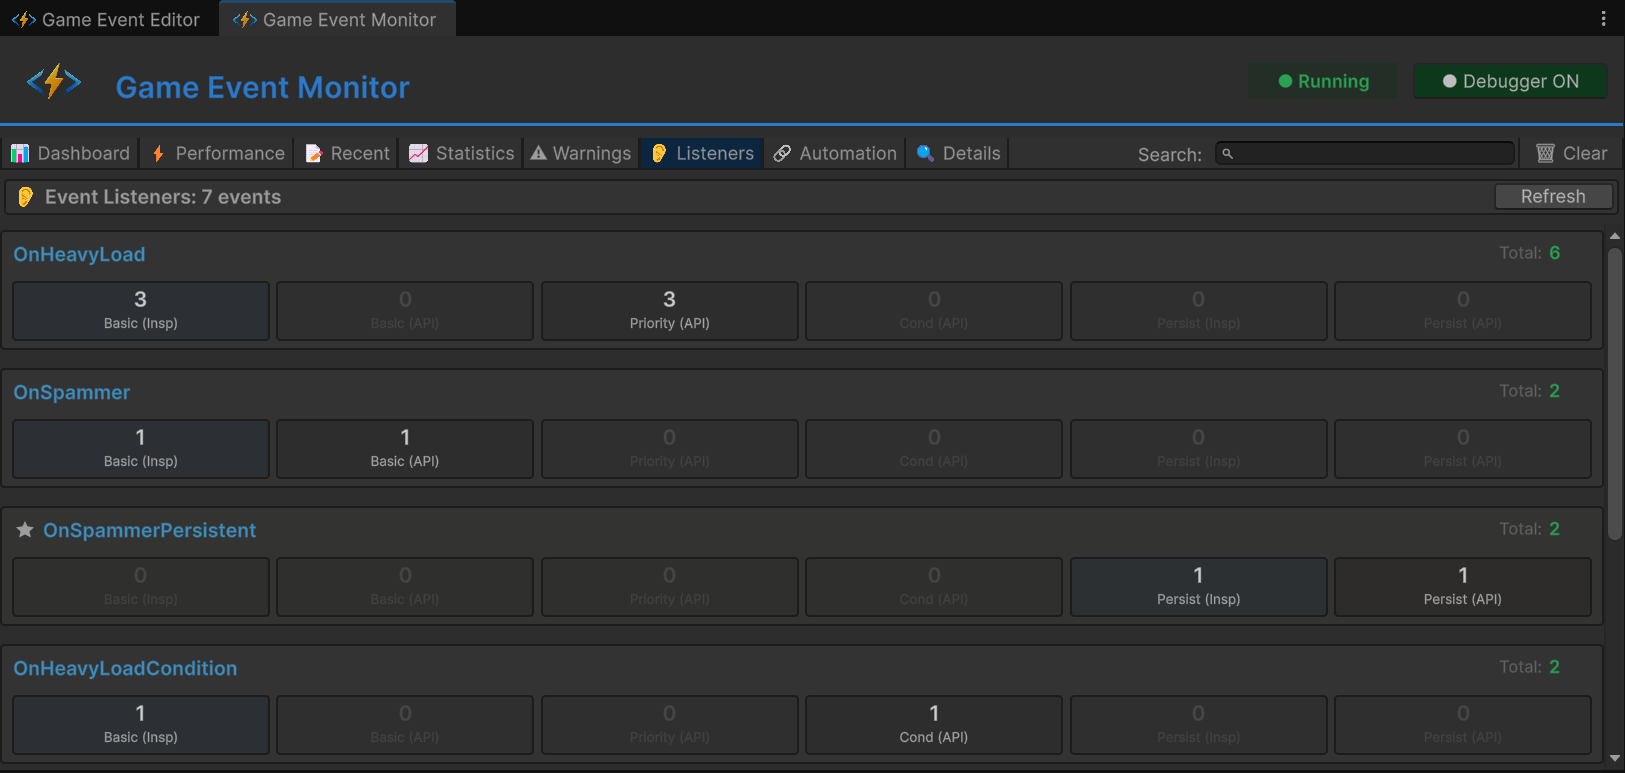
Select an event (e.g., OnHeavyLoad) to see detailed breakdown:
Listener Categories:
| Category | Meaning | Icon |
|---|---|---|
| Basic | Standard AddListener | 📌 |
| Priority | AddPriorityListener with priority value | 🔢 |
| Conditional | AddConditionalListener with predicate | ✅ |
| Persistent | AddPersistentListener (survives scenes) | 🧬 |
Breakdown Grid:
📊 Total Active Listeners: 5
│
├─ 🔗 Basic Listeners (1)
│  ├─ 📦 Inspector Bindings: 0
│  └─ 💻 API Bindings: 1
│     └─ ⚙️ RuntimeMonitorReceiver.OnHeavyExecution
│
├─ ⚖️ Priority Queue (3)
│  ├─ 🥇 High Priority (100): 1
│  │  └─ ⚙️ RuntimeMonitorReceiver.OnHeavyPreCheck
│  ├─ 🥈 Normal Priority (0): 1
│  │  └─ ⚙️ RuntimeMonitorReceiver.OnHeavyExecution
│  └─ 🥉 Low Priority (-100): 1
│     └─ ⚙️ RuntimeMonitorReceiver.OnHeavyPostCheck
│
├─ 🛡️ Conditional Guards (1)
│  └─ 💎 [Prio: 50] RuntimeMonitorReceiver.OnHeavyCriticalWarning
│     └─ 🔍 Predicate: (sender, info) => info.isCritical
│
└─ 💎 Persistent Registry (0)
   └─ (No cross-scene listeners active)
Test Results (Unit B):
- Total: 4-5 listeners
- Priority Distribution: High (1), Normal (1), Low (1)
- Conditional: 1 (with predicate preview)
Usage:
- Verify code-based registrations worked
- Check listener execution order (priority values)
- Debug missing listeners (expected vs actual count)
- Audit persistent listeners (memory leak prevention)
- Inspector Bindings: Configured in Behavior window
- API Bindings: Registered via
AddListenerin code - Both show up here—validates your hybrid approach
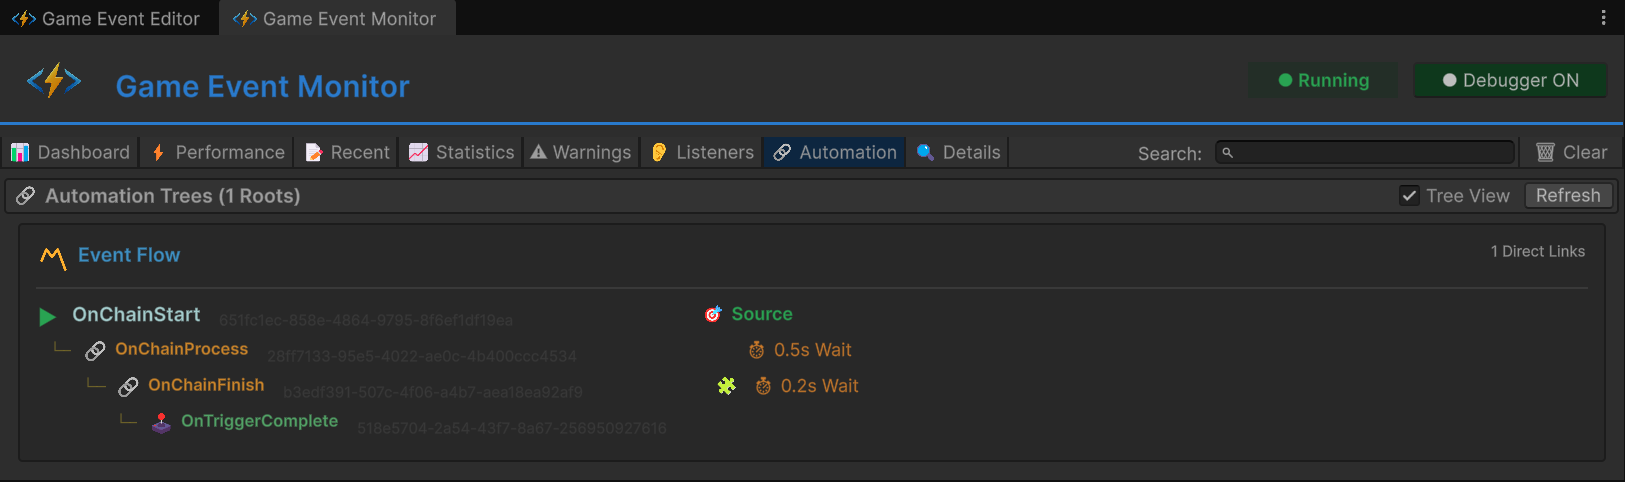
Tab 7: 🔗 Automation (Programmatic Flow Visualization)
Focus: Visualize code-built Trigger/Chain graphs
Tree View Structure:
▼ OnChainStart (Root, <DamageInfo>)
  │
  ├─ 🔗 Chain → OnChainProcess
  │   ├─ ⏱️ Delay: 0.5s
  │   ├─ ✅ Pass Argument
  │   └─ Type: <DamageInfo>
  │
  └─ (OnChainProcess expanded)
      │
      ├─ 🔗 Chain → OnChainFinish
      │   ├─ ⏱️ Delay: 0.2s
      │   ├─ 🧩 Condition: info.amount > 50
      │   ├─ ✅ Pass Argument
      │   └─ Type: <DamageInfo>
      │
      └─ (OnChainFinish expanded)
          │
          └─ 🕹️ Trigger → OnTriggerComplete
              ├─ ❌ Block Argument
              └─ Type: (void)
Badge Legend:
| Badge | Meaning |
|---|---|
⏱️ 0.5s | Delay configured |
| 🧩 | Condition enabled |
| ✅ | Argument passing enabled |
| ❌ | Argument blocked |
| 🔗 | Chain node (sequential) |
| 🕹️ | Trigger node (parallel) |
Test Results (Unit C):
- Root:
OnChainStart - Depth: 3 levels (Start → Process → Finish → Complete)
- Mixed Types: Chain (sequential) + Trigger (parallel) combined
Usage:
- Verify programmatic graphs built correctly
- Debug broken chains (missing nodes)
- Visualize complex automation without opening Flow Graph window
- Compare code-built vs visual-built graphs
- This tab: Shows code-built graphs (
AddChainEvent,AddTriggerEvent) - Flow Graph window: Shows visual-built graphs (created via UI)
- Both are valid, both are debuggable
Tab 8: 🔍 Event Details (Deep Dive)
Focus: Single-event analysis and history
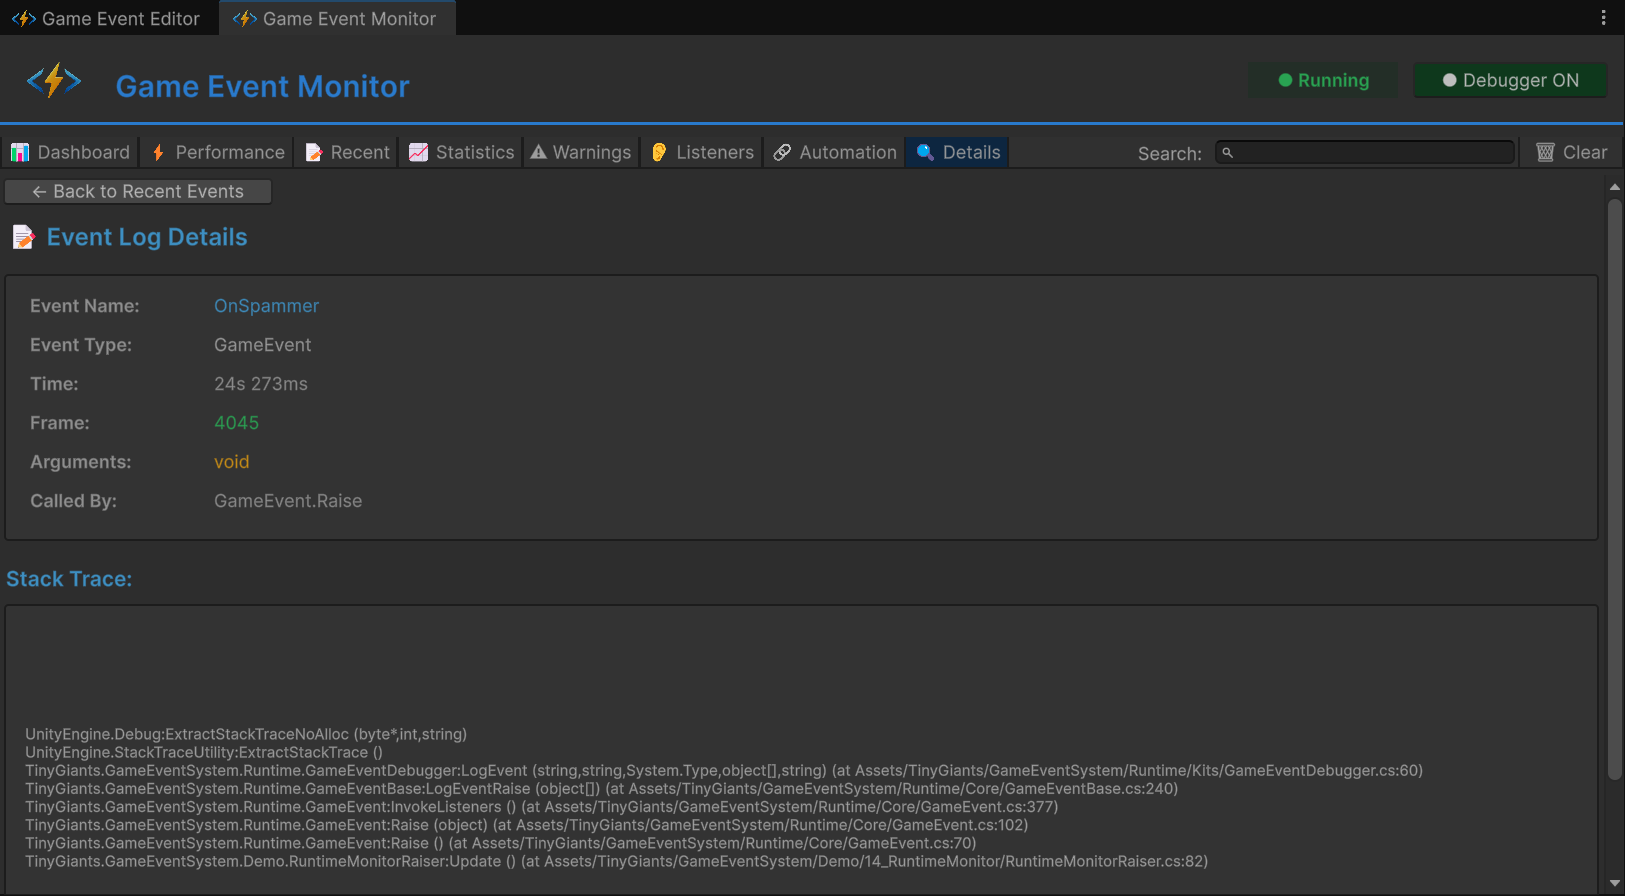
Click "Details" or "View" from any other tab to drill down.
Sections:
1. Metadata:
- GUID: Unique identifier (immutable)
- Type: Full generic signature
- Category: Organizational tag
- Database: Source asset file
2. Performance Summary:
- Avg/Min/Max Time: Same as Performance tab
- GC Allocation: Memory profile
- Listener Count: Current subscribers
3. Frequency Summary:
- Total Fires: Since play start
- Fires/Sec: Current rate
- Avg Interval: Between fires
- Last Fire: Time ago
4. Recent Activity (Filtered):
- Event-specific log stream
- Only shows this event's history
- Full stack traces available
5. Automation (If Applicable):
- Shows this event's place in Flow Graph
- Upstream/downstream connections
Usage:
- Comprehensive single-event analysis
- Compare before/after optimization
- Export data for team review
🏗️ Scene Architecture
Event Organization
Events organized by test unit in Game Event Editor:
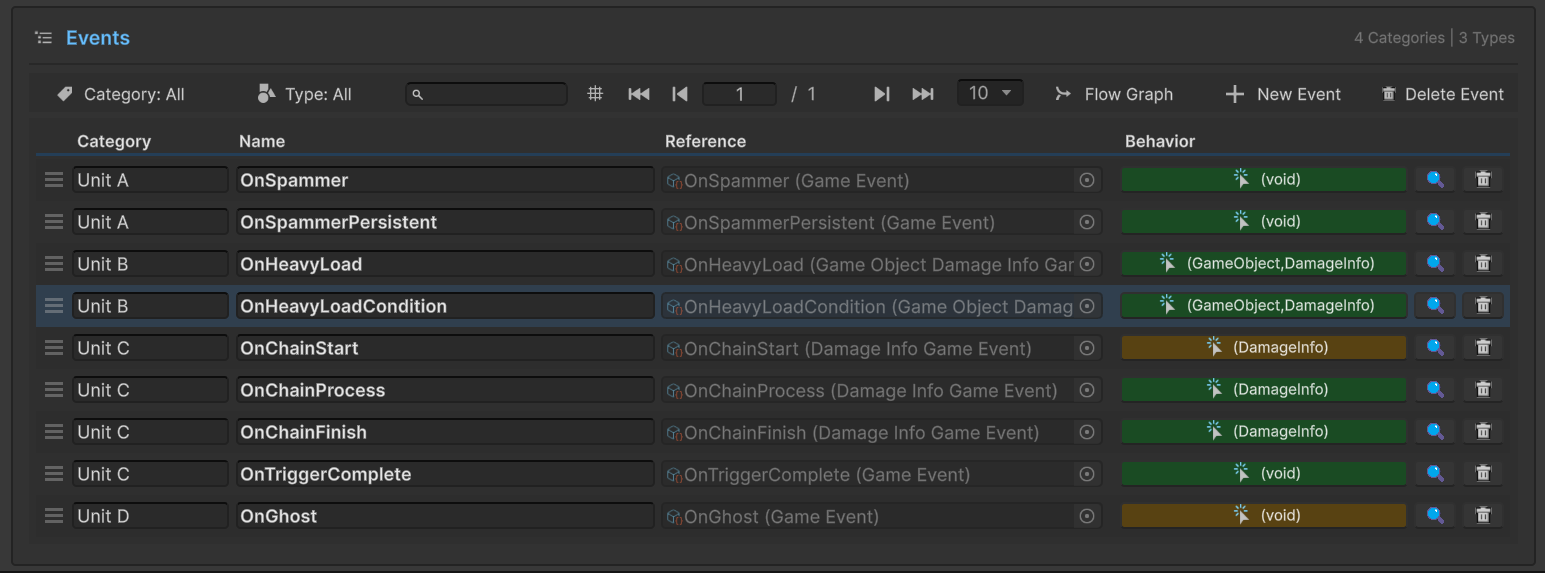
| Category | Event Name | Type | Purpose |
|---|---|---|---|
| Unit A | OnSpammer | GameEvent | High-frequency spam |
| Unit A | OnSpammerPersistent | GameEvent | Persistent spam |
| Unit B | OnHeavyLoad | GameEvent<GameObject, DamageInfo> | Performance test |
| Unit B | OnHeavyLoadCondition | GameEvent<GameObject, DamageInfo> | Conditional test |
| Unit C | OnChainStart | GameEvent<DamageInfo> | Root (gold) |
| Unit C | OnChainProcess | GameEvent<DamageInfo> | Chain step 1 |
| Unit C | OnChainFinish | GameEvent<DamageInfo> | Chain step 2 |
| Unit C | OnTriggerComplete | GameEvent | Chain step 3 (trigger) |
| Unit D | OnGhost | GameEvent | Integrity test |
Flow Graph Configuration
Programmatic chain built in code:
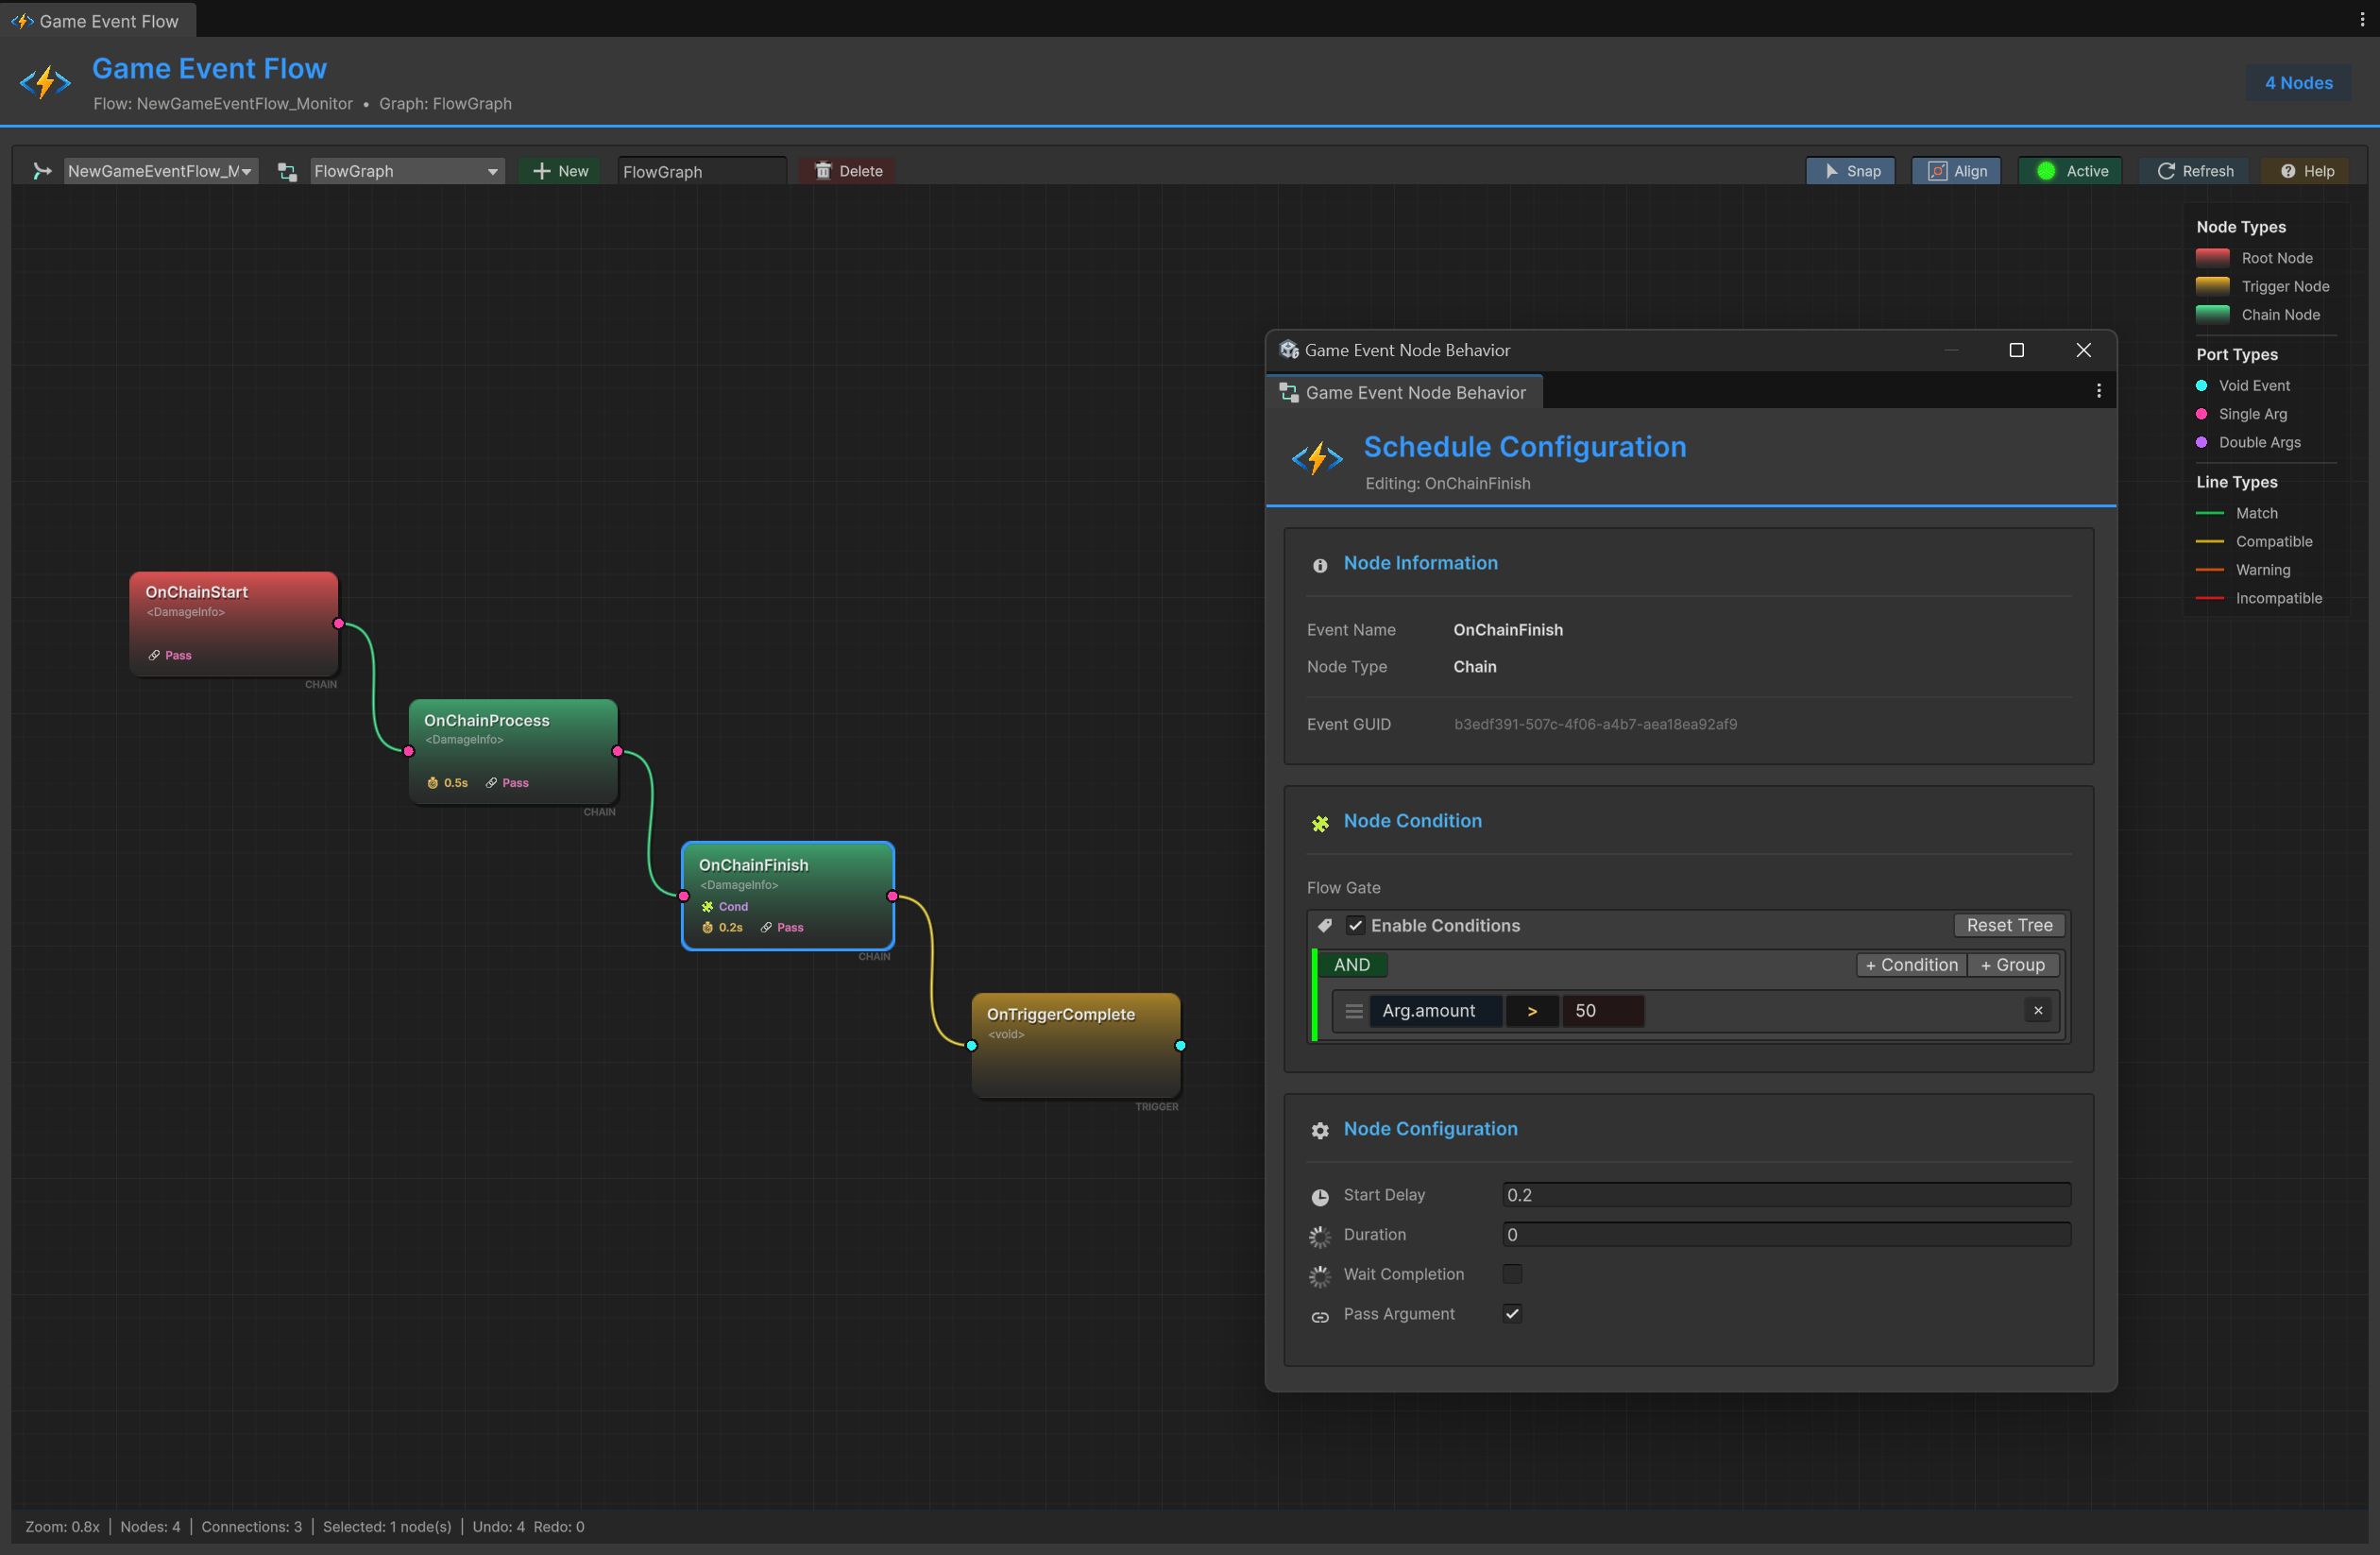
Graph Structure:
- 🔴 OnChainStart (Root, Red) - Entry point
- 🟢 OnChainProcess (Chain, Green) - Step 1 (Delay: 0.5s)
- 🟢 OnChainFinish (Chain, Green) - Step 2 (Delay: 0.2s, Condition: amount > 50)
- 🟡 OnTriggerComplete (Trigger, Yellow) - Step 3 (Argument blocked)
Connection Types:
- 🟢 Green "CHAIN" lines - Sequential execution
- 🟡 Yellow "TRIGGER" line - Parallel execution
Raiser Setup (RuntimeMonitorRaiser)
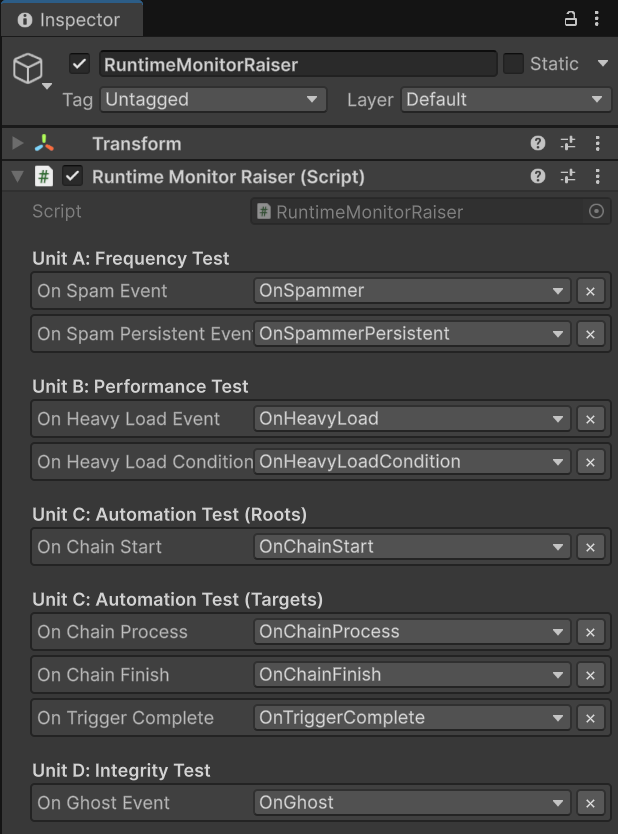
Unit A: Frequency Test
On Spam Event: OnSpammerOn Spam Persistent Event: OnSpammerPersistent
Unit B: Performance Test
On Heavy Load Event: OnHeavyLoadOn Heavy Load Condition Event: OnHeavyLoadCondition
Unit C: Automation Test (Roots)
On Chain Start: OnChainStart
Unit C: Automation Test (Targets)
On Chain Process: OnChainProcessOn Chain Finish: OnChainFinishOn Trigger Complete: OnTriggerComplete
Unit D: Integrity Test
On Ghost Event: OnGhost
Receiver Setup (RuntimeMonitorReceiver)
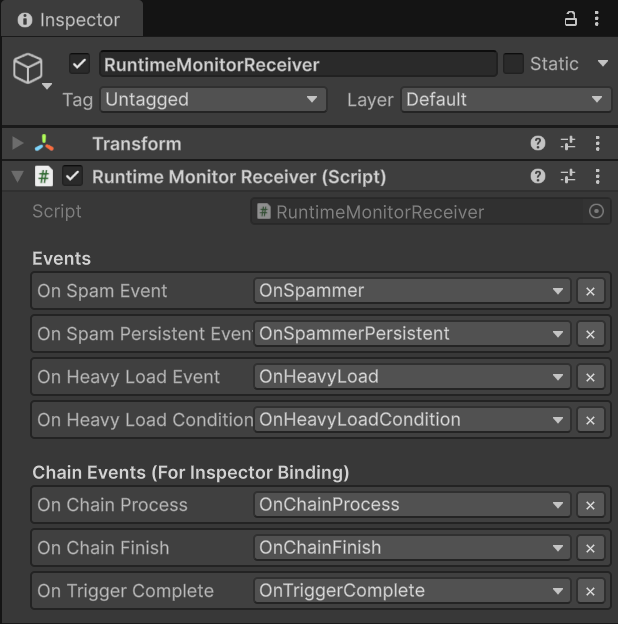
Events (Asset References):
- Same events as Raiser
Chain Events (For Inspector Binding):
On Chain Process,On Chain Finish,On Trigger Complete- These have Inspector-based listeners (drag & drop in Behavior window)
- Complements code-based API listeners
💻 Code Breakdown
Simulating Performance Issues (Unit B)
RuntimeMonitorReceiver.cs - Heavy Execution:
public void OnHeavyExecution(GameObject sender, DamageInfo info)
{
    // ⚠️ INTENTIONAL LAG FOR TESTING
    // In production, NEVER use Thread.Sleep in game logic!
    // This forces execution time to >5ms to trigger Monitor warnings
    Thread.Sleep(6);  // ← Simulates expensive computation

    Debug.Log($"[Receiver] Processed heavy data. Latency: 6ms (simulated)");
}
Why this works:
Thread.Sleep(6)blocks main thread for 6 milliseconds- Monitor's Performance tab tracks execution time per listener
- 6ms exceeds 5ms threshold → triggers YELLOW warning
- Click button 2x with
Thread.Sleep(12)→ RED critical warning
Building Programmatic Automation (Unit C)
RuntimeMonitorRaiser.cs - Awake() Graph Construction:
private ChainHandle _chainProcessHandle;
private ChainHandle _chainFinishHandle;
private TriggerHandle _triggerCompleteHandle;

private void Awake()
{
    // ✅ BUILD CHAIN IN CODE (Not visual graph!)

    // Step 1: Start → (Delay 0.5s) → Process
    _chainProcessHandle = onChainStart.AddChainEvent(
        targetEvent: onChainProcess,
        delay: 0.5f,           // ← Pause for half a second
        passArgument: true     // ← Forward DamageInfo
    );

    // Step 2: Process → (Condition + Delay 0.2s) → Finish
    _chainFinishHandle = onChainProcess.AddChainEvent(
        targetEvent: onChainFinish,
        delay: 0.2f,
        condition: (info) => info.amount > 50f,  // ← Only high damage continues
        passArgument: true
    );

    // Step 3: Finish → (Trigger, Block Args) → Complete
    _triggerCompleteHandle = onChainFinish.AddTriggerEvent(
        targetEvent: onTriggerComplete,
        passArgument: false    // ← Block arguments (type conversion void)
    );
}

private void OnDestroy()
{
    // ✅ CLEANUP: MANDATORY for dynamic graphs
    onChainStart.RemoveChainEvent(_chainProcessHandle);
    onChainProcess.RemoveChainEvent(_chainFinishHandle);
    onChainFinish.RemoveTriggerEvent(_triggerCompleteHandle);
}
Graph Execution Flow:
🖱️ User Interaction: Button Clicked
│
🚀 [ INITIATION ] ➔ onChainStart.Raise(DamageInfo)
│   📦 Payload: { amount: 100, isCritical: true }
│
⏳ [ SCHEDULING ] ➔ System Pauses for 0.5s
│   └─► ⚙️ onChainProcess.Raise(DamageInfo)
│
⚖️ [ EVALUATION ] ➔ Gate: `100 > 50` ?
│   └─► ✅ Result: YES (Condition Passed)
│
⏳ [ SCHEDULING ] ➔ System Pauses for 0.2s
│   └─► 🎯 onChainFinish.Raise(DamageInfo)
│
🧪 [ PURIFICATION ] ➔ Parameter Stripping: `DamageInfo` ➔ `void`
│   └─► 🏁 onTriggerComplete.Raise()
│
📊 Final Outcome: Pipeline Finalized | ⚡ Timing: 0.7s Total Delay
Monitor Visibility:
- Automation Tab: Shows this exact tree structure
- Recent Events Tab: Shows sequential firing pattern with timing
- Performance Tab: Tracks each step's execution time
Registering Multi-Priority Listeners (Unit B)
RuntimeMonitorReceiver.cs - OnEnable():
private void OnEnable()
{
    // ✅ POPULATE LISTENERS TAB WITH VARIETY

    // Basic listener (no priority)
    onSpamEvent.AddListener(OnSpamReceived);

    // Priority listeners (execution order)
    onHeavyLoadEvent.AddPriorityListener(OnHeavyPreCheck, priority: 100);   // Runs 1st
    onHeavyLoadEvent.AddPriorityListener(OnHeavyExecution, priority: 0);    // Runs 2nd (lag here)
    onHeavyLoadEvent.AddPriorityListener(OnHeavyPostCheck, priority: -100); // Runs 3rd

    // Conditional listener with priority
    onHeavyLoadConditionEvent.AddConditionalListener(
        OnHeavyCriticalWarning,
        predicate: (sender, info) => info.isCritical,  // ← Only if critical
        priority: 50
    );
}

private void OnDisable()
{
    // ✅ CLEANUP
    onSpamEvent.RemoveListener(OnSpamReceived);

    onHeavyLoadEvent.RemovePriorityListener(OnHeavyPreCheck);
    onHeavyLoadEvent.RemovePriorityListener(OnHeavyExecution);
    onHeavyLoadEvent.RemovePriorityListener(OnHeavyPostCheck);

    onHeavyLoadConditionEvent.RemoveConditionalListener(OnHeavyCriticalWarning);
}
Monitor Visibility:
- Listeners Tab: Shows 4 listeners for
OnHeavyLoad- Priority breakdown: High (1), Normal (1), Low (1)
- Conditional (1) with predicate preview
- Performance Tab: Tracks cumulative execution time (sum of all listeners)
Persistent Listener Management (Unit A)
RuntimeMonitorReceiver.cs - Awake/OnDestroy:
private void Awake()
{
    // ✅ PERSISTENT LISTENER (Survives scene reload)
    // Registered in Awake, cleaned in OnDestroy
    onSpamPersistentEvent.AddPersistentListener(OnSpamPersistentLog, priority: -10);
}

private void OnDestroy()
{
    // ✅ CLEANUP PERSISTENT
    onSpamPersistentEvent.RemovePersistentListener(OnSpamPersistentLog);
}

public void OnSpamPersistentLog()
{
    // Empty method—exists only for Monitor to count
    // Simulates background tracking (e.g., analytics, achievements)
}
Monitor Visibility:
- Listeners Tab: Shows "Persistent Listeners: 1" for
OnSpammerPersistent - Dashboard: Tracks persistent listener health
🎯 Production Debugging Workflow
Scenario 1: Frame Drops During Combat
Symptoms:
- FPS drops from 60 to 30 during combat
- No obvious Unity Profiler spikes
Debug Steps:
- Open Performance Tab
- Sort by "Avg Time" (descending)
- Look for events with >2ms execution
- Click event → Details Tab → See caller methods
- Optimize heavy listeners or reduce fire frequency
Scenario 2: Event Not Firing
Symptoms:
- UI button click does nothing
- Expected behavior doesn't occur
Debug Steps:
- Open Recent Events Tab
- Search for expected event name
- If found: Event firing but listeners not responding
- Go to Listeners Tab → Check listener count
- Verify method names match
- If not found: Event not being raised
- Check raiser code's
.Raise()call - Verify event asset reference in Inspector
- Check raiser code's
Scenario 3: Memory Leak Suspected
Symptoms:
- Memory usage grows over time
- GC spikes increase
Debug Steps:
- Open Performance Tab
- Check "GC Alloc" column
- Look for events allocating >0 KB per fire
- Click event → Listeners Tab → Check for closure allocations
- Refactor to avoid per-fire allocations
Scenario 4: Ghost Events (Dead Code)
Symptoms:
- Warning tab shows
[No Listeners]
Debug Steps:
- Open Warnings Tab
- Identify ghost events
- Option A: Event is debug-only → Ignore warning
- Option B: Listener registration failed
- Check
OnEnableforAddListenercall - Verify event asset reference matches
- Check
- Option C: Dead code → Remove
.Raise()call
🔑 Monitor Best Practices
✅ DO
During Development:
- Keep Monitor open in second display
- Check after adding new events
- Verify listener counts match expectations
- Profile before/after optimizations
During Stress Testing:
- Generate high load (like this demo)
- Monitor Performance tab for >1ms events
- Check Warnings tab for integrity issues
- Export metrics for team review
In Production Builds:
- Enable Monitor in Development Builds
- Test on target devices (mobile, console)
- Profile in realistic scenarios
- Document performance baselines
❌ DON'T
Performance Anti-Patterns:
- Fire events every frame (>60/sec) without batching
- Allocate memory in listeners (closures, LINQ)
- Call expensive operations synchronously
Debugging Anti-Patterns:
- Ignore yellow warnings ("it's just a warning")
- Rely solely on
Debug.Logfor event debugging - Skip listener cleanup (
OnDisablemissing) - Leave test events in production builds
📊 Monitor vs Unity Profiler
| Feature | Game Event Monitor | Unity Profiler |
|---|---|---|
| Focus | Event system only | Entire engine |
| Granularity | Per-event metrics | Per-method calls |
| Listener Tracking | ✅ Built-in | ❌ Manual |
| Frequency Analysis | ✅ Built-in | ⚠️ Indirect |
| Flow Visualization | ✅ Automation tab | ❌ N/A |
| Warnings | ✅ Automatic | ❌ Manual analysis |
| Learning Curve | Easy | Steep |
| Best For | Event debugging | Overall performance |
Recommended Workflow:
- Monitor: Identify problematic events
- Unity Profiler: Deep-dive into listener methods
- Monitor: Verify fixes reduced execution time
🎯 What's Next?
You've mastered the complete GameEventSystem workflow—from basic events to enterprise observability. The Examples section is complete!
Next Steps:
- Explore Tools & Support for advanced features
- Review Best Practices for production patterns
- Check Community & Support for help
📚 Related Documentation
- Runtime Monitor Tool - Complete Monitor documentation
- Best Practices - Performance optimization patterns
- Programmatic Flow - Building graphs in code
- API Reference - Complete method signatures